Domo + Snowflake: A Practical Cost Optimisation Playbook
How right-sizing your warehouses and optimising Domo settings can cut your Snowflake bill by 30–50%
Snowflake’s consumption-based pricing model is both a blessing and a curse. The flexibility to scale compute on demand means you only pay for what you use but without proper governance, that bill can spiral quickly. For Domo customers, the interaction between dashboard queries and warehouse credits is often the biggest blind spot.
This guide focuses on two levers you can pull immediately: optimising Domo’s query behavior and right-sizing your Snowflake warehouses based on actual usage patterns.
This guide assumes you are using Snowflake with Domo’s Cloud Amplifier product, if you are using Domo storage there is no cost per query and so this guide is not designed for you.
Part 1: Domo-Side Optimisations
Before you touch your Snowflake configuration, fix the demand side. Domo generates queries constantly, usually every card refresh, every filter change, every page load triggers SQL that hits your warehouse. Here’s how to make those queries more efficient.
There broadly are two ways that we can control how and when queries are sent to Snowflake - one is via data freshness checks and the other is using Domo’s query cache.
1.1 Understanding Domo’s Query Patterns
Domo issues queries in several scenarios, each with different optimisation opportunities:
| Trigger | Frequency | Optimization Opportunity |
|---|---|---|
| Dataset refresh | Based on freshness check | Cache strategy, data freshness |
| Page load | Every view | PDP, optimized queries |
| Filter/Drill interaction | User-driven | Pre-aggregation, efficient Beast Modes |
| Beast Mode calculations | Every query | Push to data pipeline when possible |
| DataFlow/Magic ETL | Scheduled | Batch during off-peak hours |
Not all queries need fresh data. A dashboard viewed 500 times daily doesn’t need 500 warehouse queries if the underlying data only updates nightly - we can use Domo query cache to avoid sending duplicate queries to Snowflake.
1.2 Cloud Amplifier: Data Freshness and Cache TTL
Domo has multiple caching layers, use them to save on Snowflake costs.
For each Snowflake connection, you control how often Domo checks fresh data from Snowflake. Right now (as of Feb 2026) this is done at the connection level, however there are plans to make this configurable at the dataset level which would provide more fine grained control.
Match your cache strategy to business needs, not technical defaults, If a dataset updates every 5 minutes but users only check it hourly, you’re burning 12× the necessary credits.
Use the DomoStats datasets (Activity Log and Datasets) to determine which content is being viewed the most and which datasets are powering those dashboards and apps.
Data Freshness Checks
Cloud Amplifier periodically queries Snowflake’s INFORMATION_SCHEMA to check whether source tables have been updated. By default, for Snowflake, it sends one freshness-check query per schema where you have registered datasets. These checks are lightweight, but they require a compute warehouse to be running. If your warehouse is suspended, the freshness check will wake it up and you’ll incur the 60-second minimum charge (more on this minimum 60 seconds later).
This can create a hidden cost pattern: if you have 10 schemas registered and your freshness checks run every 15 minutes, that’s 960 freshness-check queries per day. Each one wakes your warehouse if it’s suspended, potentially negating your auto-suspend savings.
Freshness checks are used if you have Magic ETL configured to run when the underlying data updates, these checks need to run to check for new data if you are wanting that data to be picked up automatically in your dataflows.
How to optimise freshness checks:
-
Align check frequency with your actual data update schedule. If your data loads once daily at 6 AM, checking for freshness every 15 minutes wastes 95 of every 96 checks. Set the freshness interval to match when data actually changes - in this example, once per day.
-
Disable off-hours checks. Since the November 2024 release, Domo supports advanced scheduling for freshness checks. You can now turn them off during nights and weekends when nobody is viewing dashboards, otherwise, freshness queries will keep waking your warehouse at 3 AM for no reason.
-
Consolidate schemas where possible. Fewer schemas means fewer freshness-check queries (one per schema per interval).
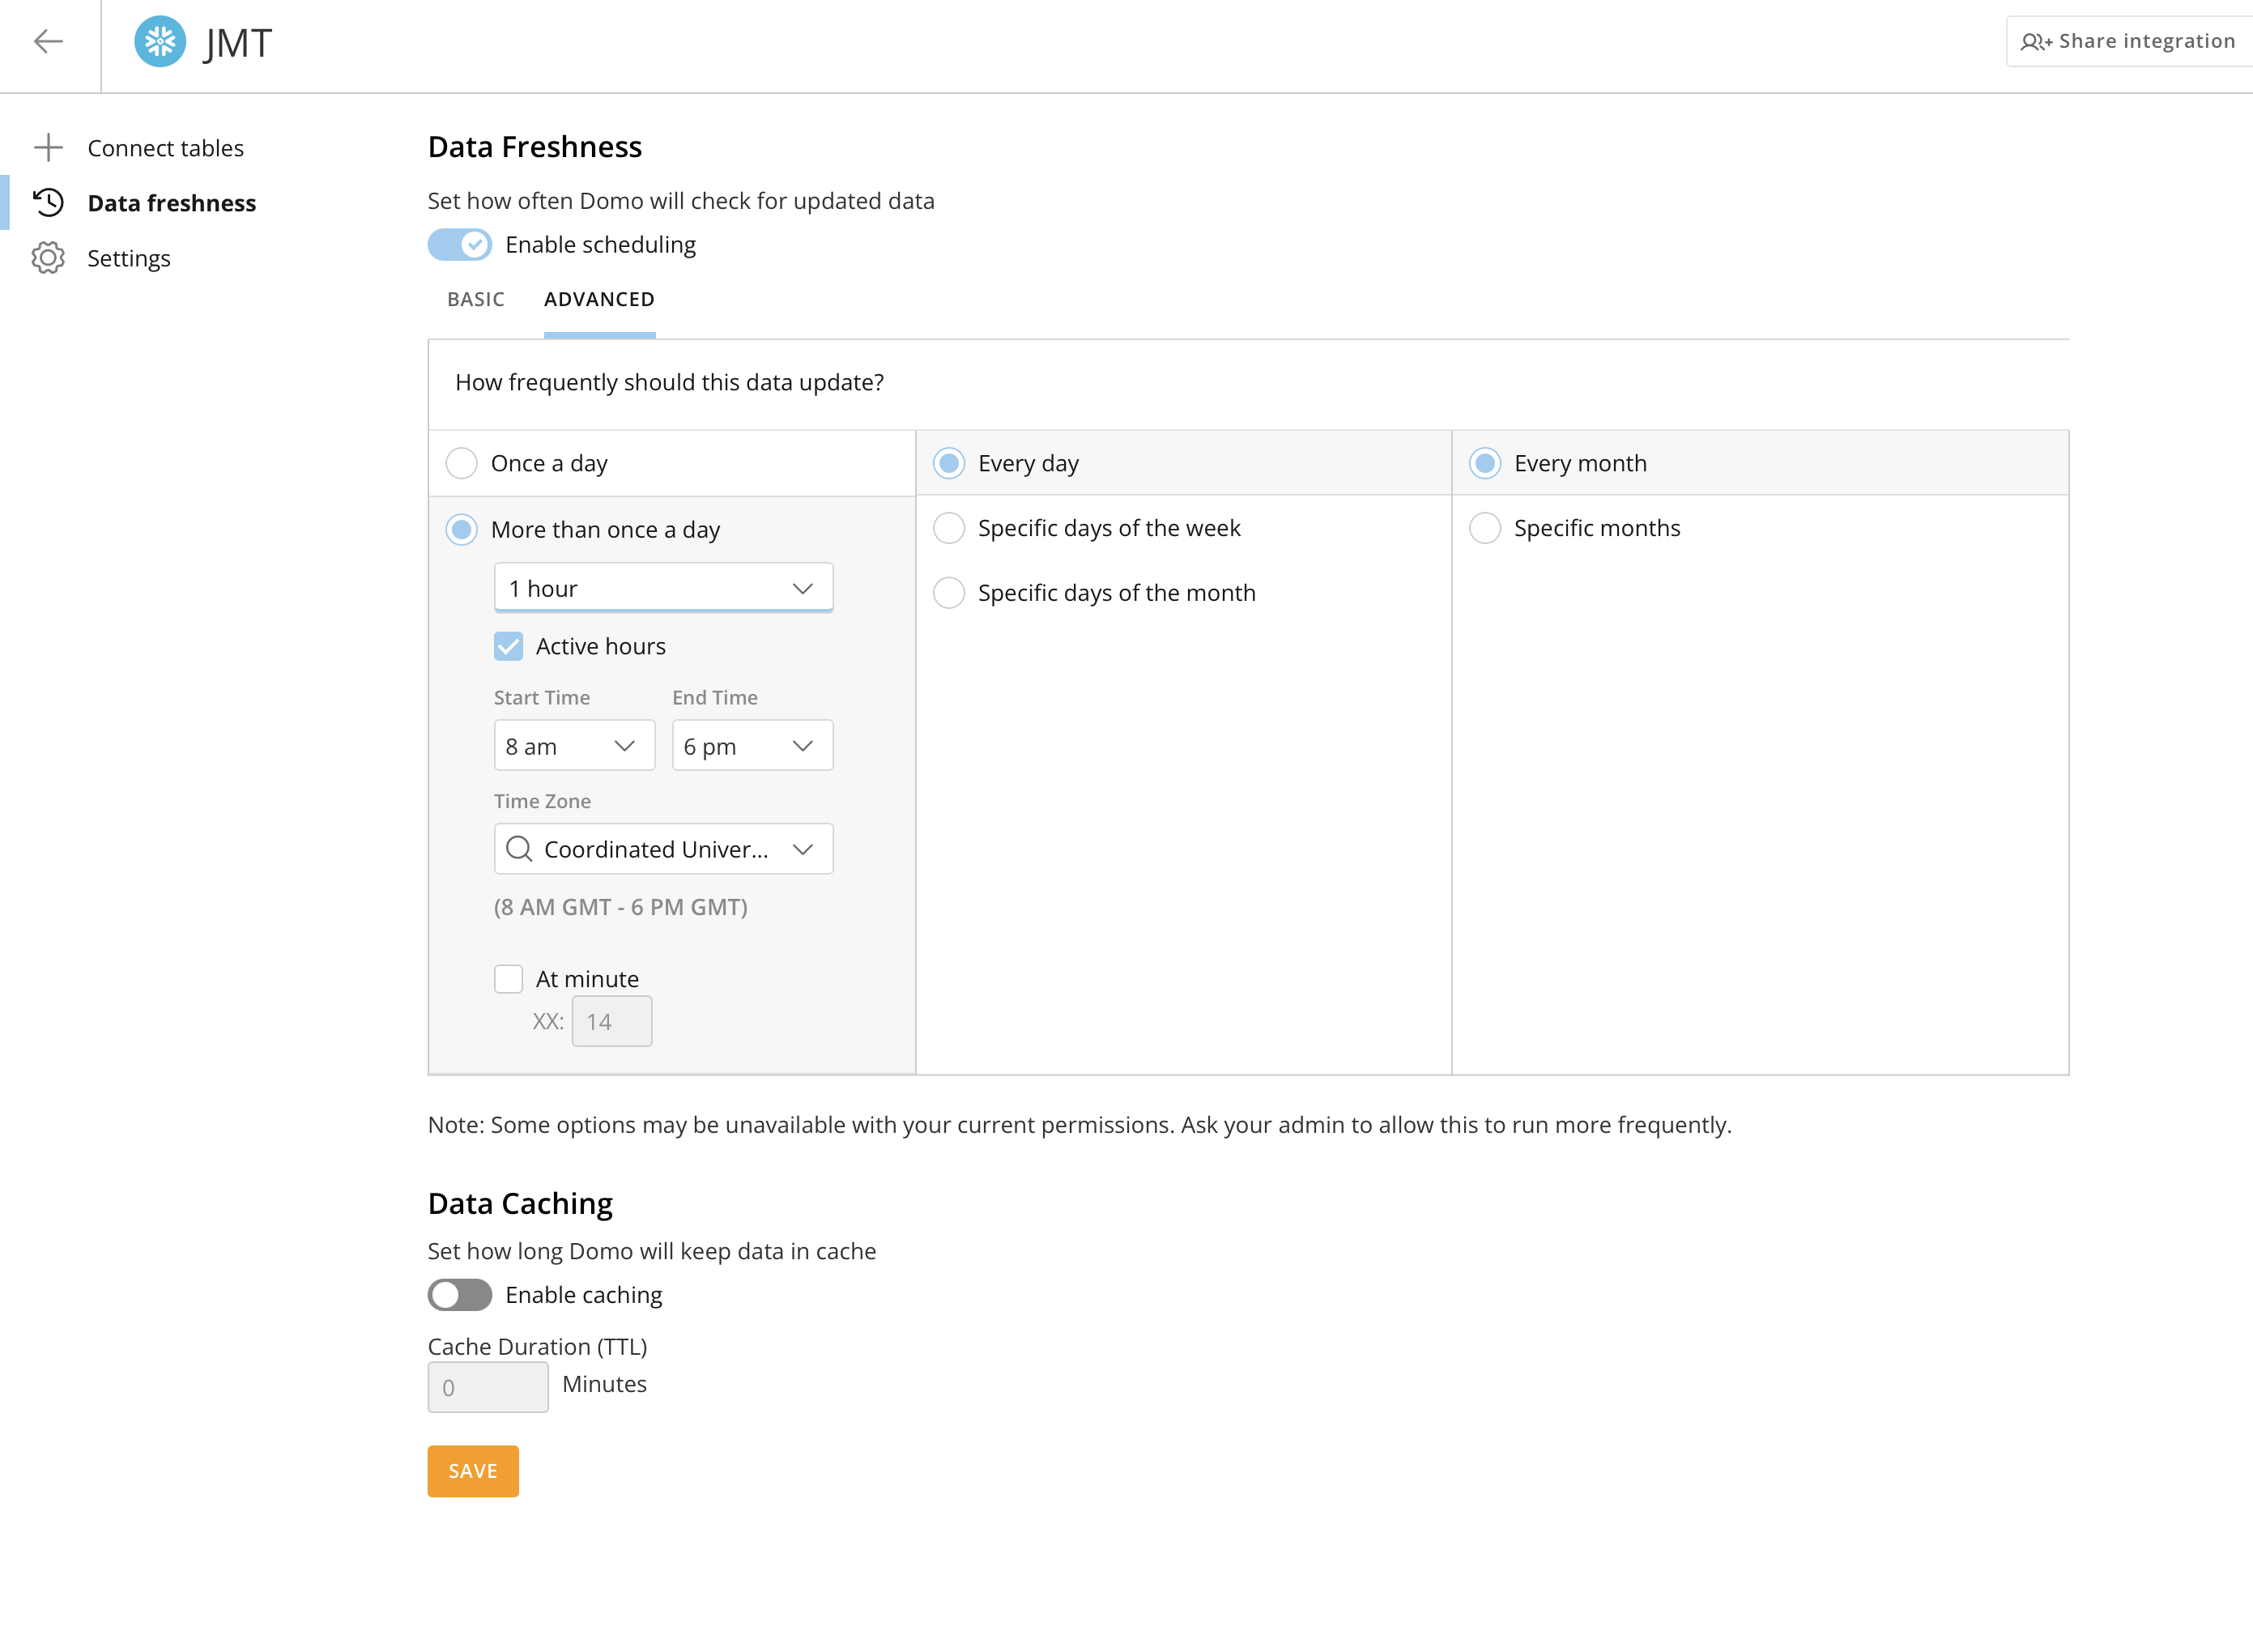
Cache TTL
Domo caches the results of individual queries (think card loads not entire tables) with a default TTL of 15 minutes. When a user loads a dashboard within the TTL window, Domo serves cached results without querying Snowflake. This is the second way we can avoid hitting Snowflake with duplicate queries.
How to optimise Cache TTL:
- Increase TTL for stable data. If a dataset updates once daily, a 15-minute cache TTL means every dashboard view after 15 minutes triggers a new Snowflake query. Set the TTL to match your freshness check interval, so if you check for new data every hour, cache for an hour.
- Keep short TTL for volatile data. For operational dashboards where users need near-real-time data, 5–15 minutes is appropriate. If you have real-time usecases, disable cache all-together to always get the most recent data from Snowflake.
- Coordinate TTL with freshness checks. There’s no benefit to a 15-minute cache TTL if your freshness check only runs every 4 hours, Domo will still serve cached data until the freshness check detects a change. Align these two settings.
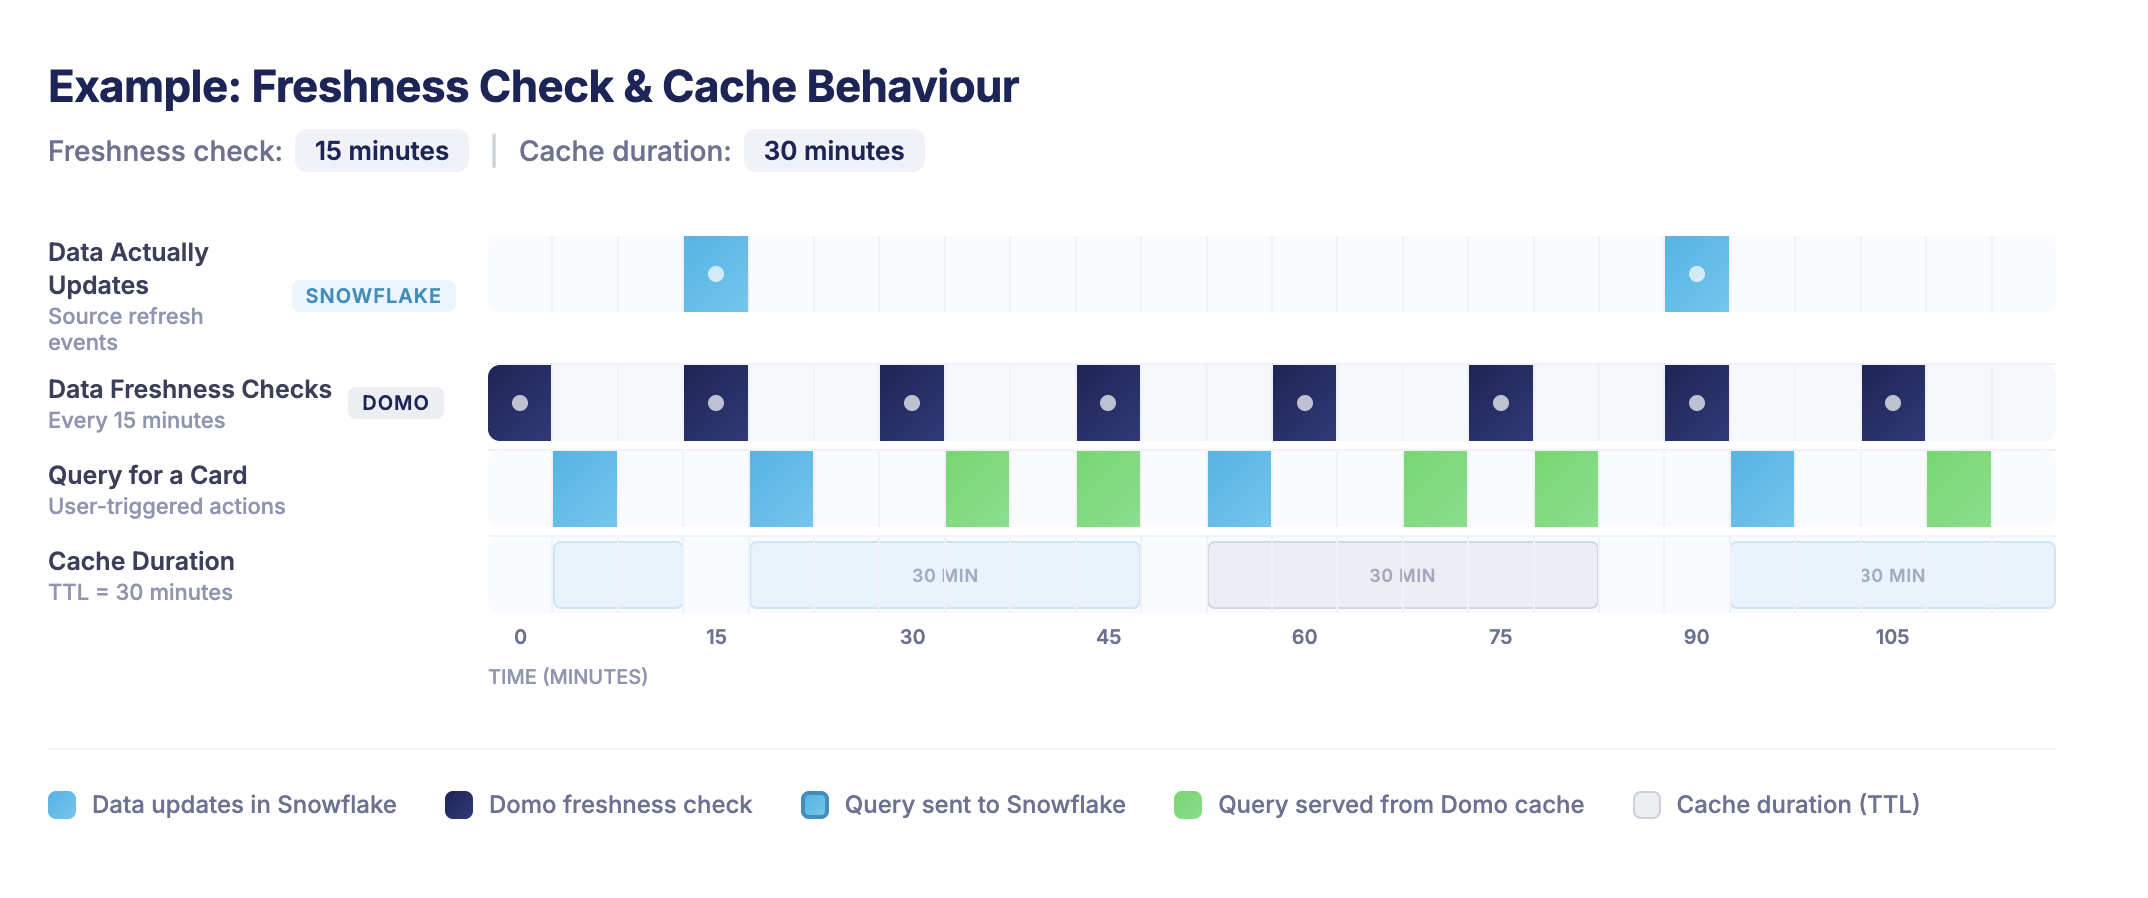
Some Examples
I think it can be difficult at times to see how cache and freshness checks work together so I have some visual examples to try and illustrate how they work (you can click any images to enlarge them).
-
Here we have freshness checks set to every 15 minutes and a cache TTL of 30 minutes.
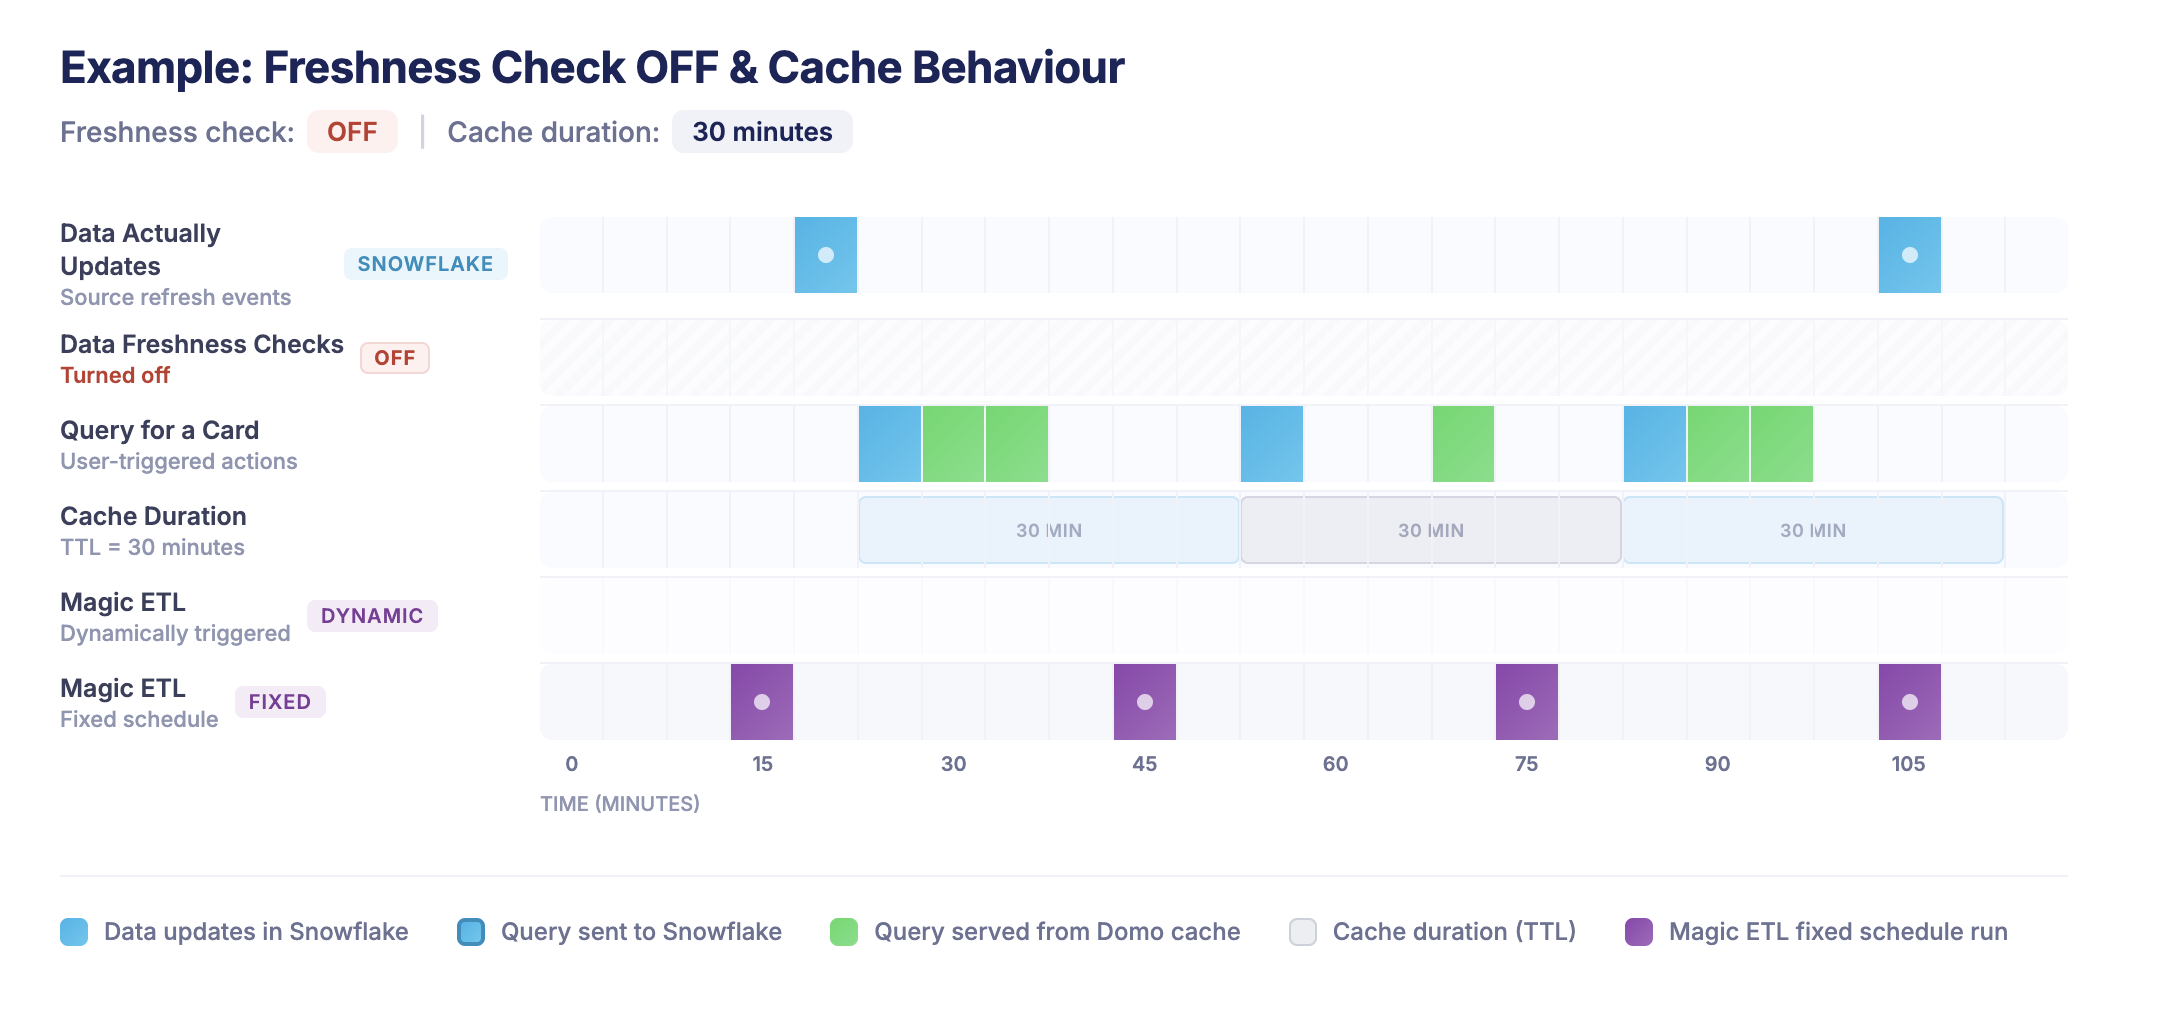
-
Here Freshness Checks are off - but there is a 30 minute Cache TTL
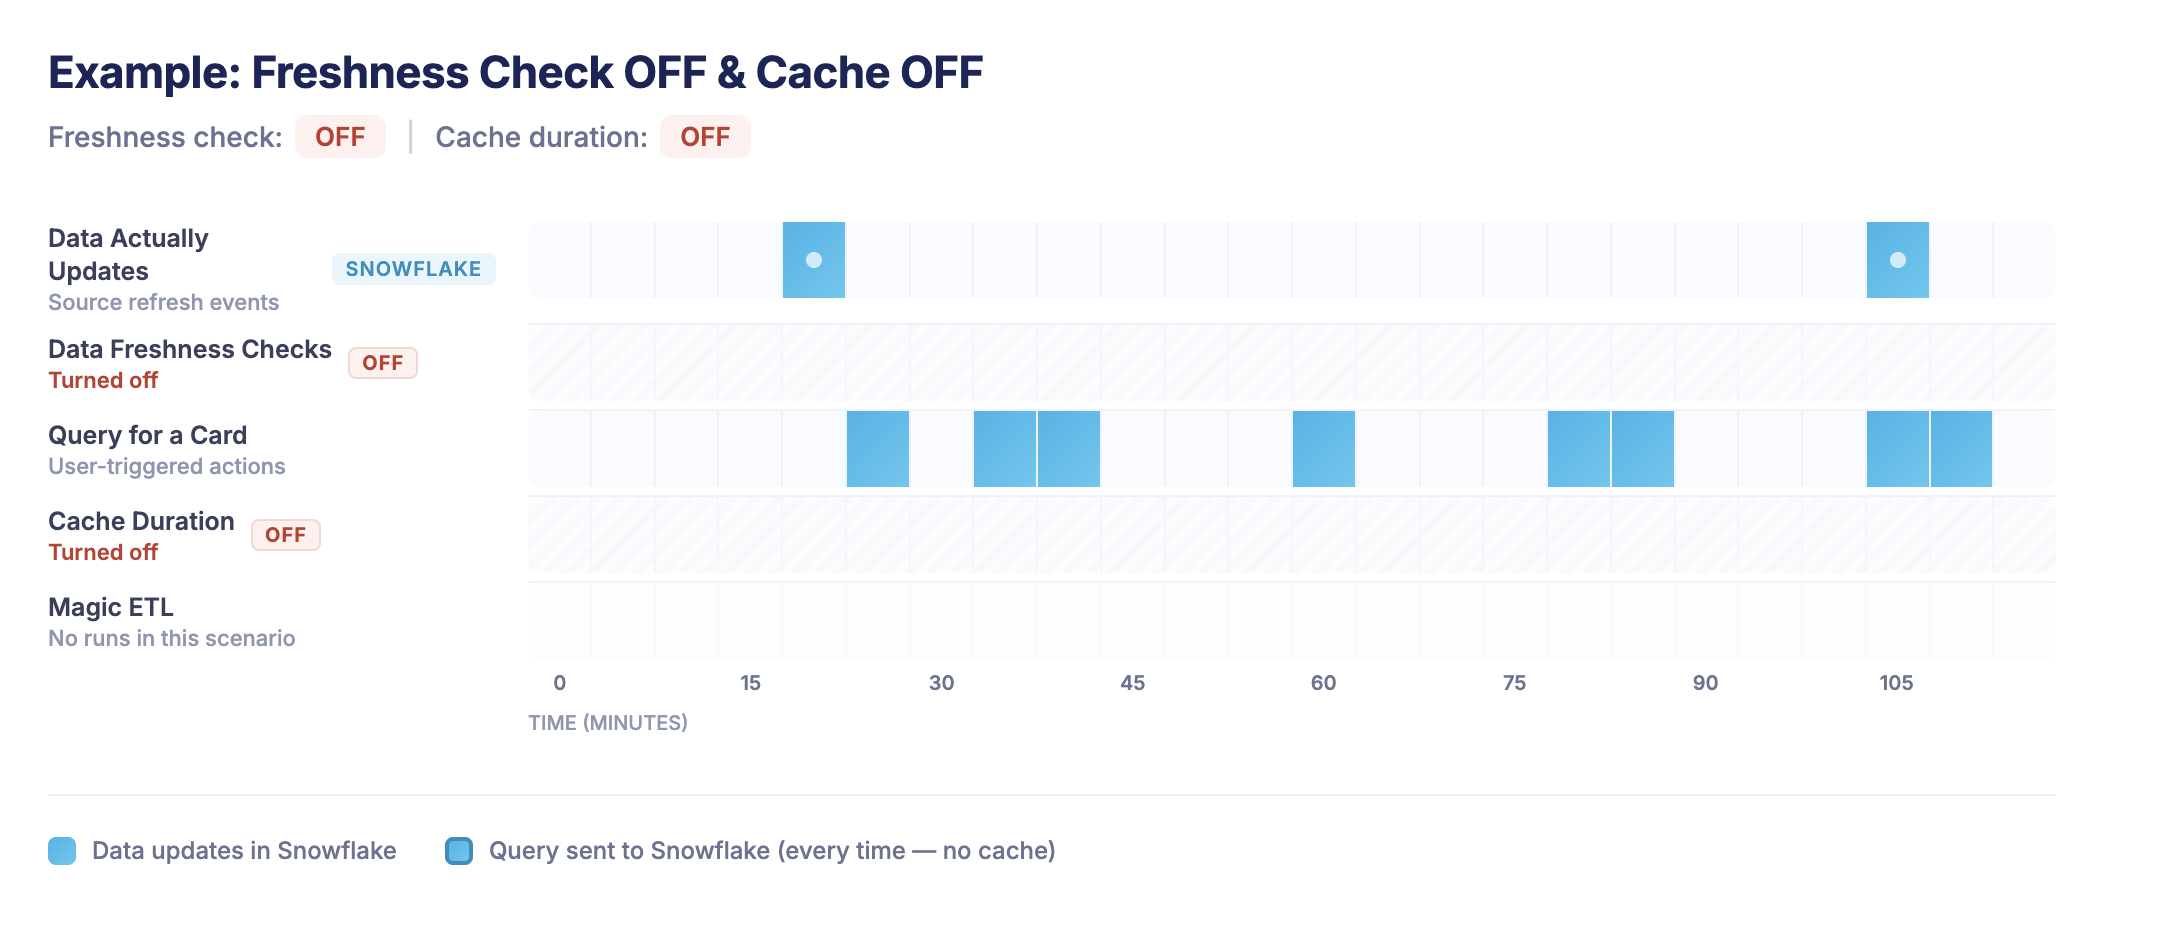
-
Here is there no Freshness check and no Domo query cache
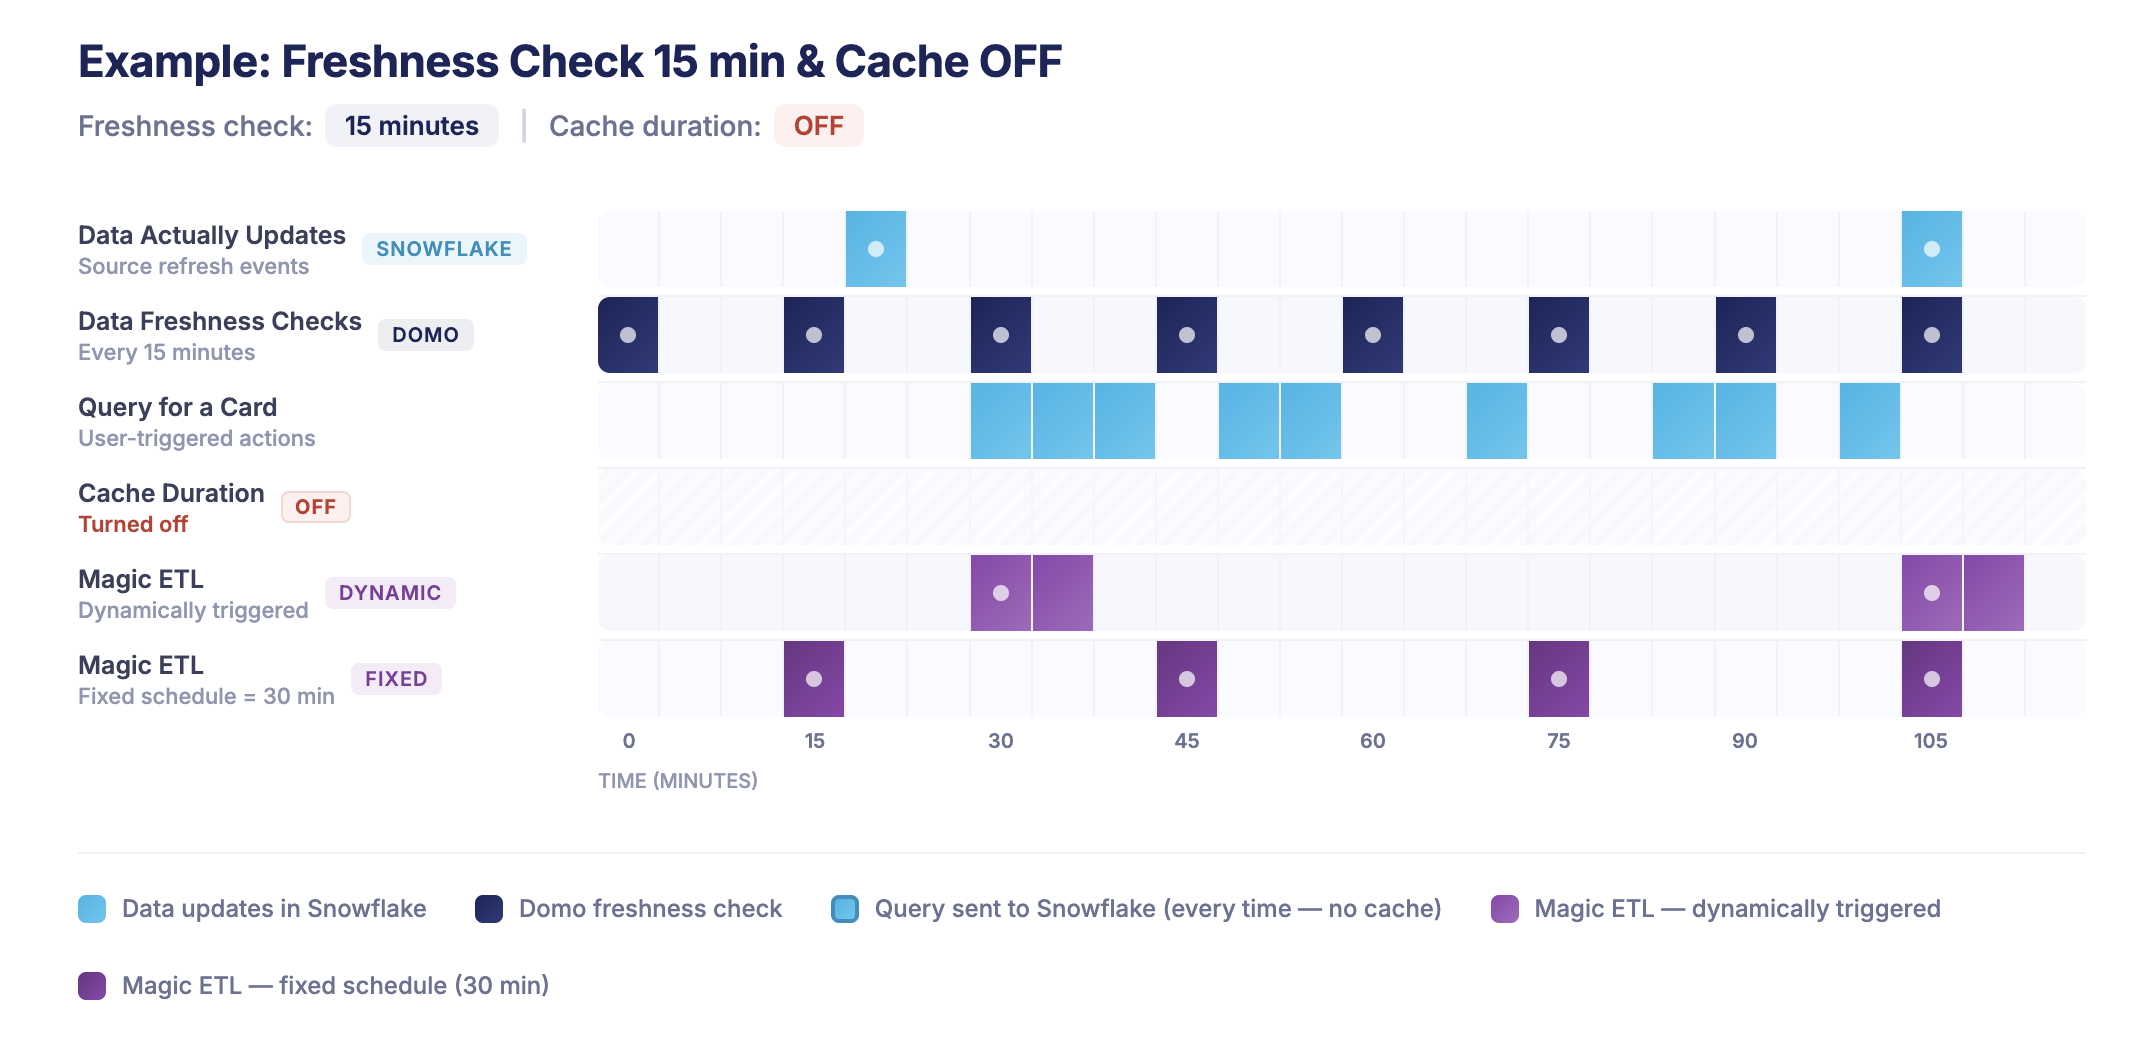
-
Here there is a freshness check of 15 minutes (to trigger Magic ETL automatically) as well as an example of Magic ETL on a fixed schedule - with no Domo query caching enabled.
And finally some common questions answered: Q: Why would I want a cache duration that is less my freshness check interval? A: For cases where you still want the Magic ETL to trigger as soon as your data updates, but still want all queries to go to Snowflake.
Q: Don’t most cloud engines have caching already? Should I still use Domo’s cache? A:_Though this typically varies by cloud, most cloud engines do cache query results for up to 24 hours._Though for optimal performance, Domo’s cache will be the fastest option when loading from a cache.
1.3 PDP (Personalized Data Permissions) Optimisation
PDP filters add WHERE clauses to every query. Poorly designed PDP can cause poor micro-partition pruning and degrade query performance:
Anti-Pattern:
-- PDP applies: WHERE user_email = 'john@company.com'
-- If user_email is not in the clustering key,
-- Snowflake cannot prune micro-partitions effectively
Best Practice:
- Use PDP on columns aligned with your Snowflake clustering keys for efficient partition pruning
- Consider pre-filtered views in Snowflake for complex permissions
- For large user bases, use row access policies in Snowflake instead and Domo’s OAuth integration option.
1.4 Beast Mode Efficiency
Every Beast Mode calculation executes in Snowflake. Push complex logic upstream when possible:
Do in Snowflake/ETL:
- Date truncations and formatting
- Complex CASE statements used across multiple cards
- Joins between large tables
Keep in Beast Mode:
- Simple aggregations (SUM, COUNT, AVG)
- User-facing labels and formatting
- Quick filters and parameters
- Ratio’ & percentages
Part 2: Snowflake Warehouse Sizing Strategy
Now that you’ve optimised Domo’s query patterns, let’s size your warehouses appropriately. The goal here is to match compute resources to actual demand without over-provisioning.
2.1 Warehouse Size Reference
For most BI workloads and in my experience X-Small or Small warehouses are sufficient, start small and scale up if required (we’ll cover how to find out if you need to scale up below).
There are costs to be saved by starting small. Snowflake charges per-second while the warehouse runs, with a 60-second minimum, even if your query only takes 1 second to complete.
This means a query taking 5 seconds on an X-Small warehouse (1 credit/hour) costs: 1 credit/hour × (60/3600) hours = 0.017 credits The same query on a Medium (4 credits/hour) costs 0.067 credits. This is 4× more for the same work if the query doesn’t benefit from parallelism.
Before we run through how to optimise Snowflake, lets first think about how we can actually scale Snowflake warehouses and how it works.
2.2 Scaling Up vs. Scaling Out: Know the Difference
These are fundamentally different strategies solving different problems. Getting this wrong can be one of the most common (and expensive) mistakes.
Note: Multi-cluster warehouses (scaling out) require Snowflake Enterprise Edition or higher. If you’re on Standard Edition, you can only scale up.
Scale Up (Bigger Warehouse Size)
Scaling up means increasing the warehouse size e.g., from Medium to Large. This adds more compute nodes to a single cluster, which helps queries that can take advantage of parallelism.
- Individual queries run faster (if they can leverage the additional compute)
- Higher per-second cost while running
- Does not help with concurrency, the same number of queries can run simultaneously
- Best for: Complex queries scanning large datasets, heavy joins, window functions
When to scale up: Your queries are individually slow (>10s execution time), and profiling shows they’re scanning large amounts of data or spilling to remote storage (BYTES_SPILLED_TO_REMOTE_STORAGE > 0 in query history).
Scale Out (Multi-Cluster)
Scaling out means adding more clusters of the same size. Each cluster handles queries independently, so you get more concurrent throughput without making individual queries faster.
- Same per-query speed and cost
- More queries can run simultaneously without queuing
- Best for: Many concurrent users, spiky traffic, dashboard page loads
Typically for powering Domo dashboards, queries generated by charts are less complex but high in volume (many users loading and opening dashboards) so scaling out is a more common design pattern than scaling up.
When to scale out: Your individual queries are fast enough, but users experience delays because queries are queuing (QUEUED_OVERLOAD_TIME > 0 in query history).
How to Identify Which You Need
Now we know how Snowflake scaling works, here’s how you can determine what you need to do.
I typically recommend Domo customers to start on an X-Small warehouse and to enable multi-clustering. From here we can track where there are bottlenecks and adjust accordingly. It’s simpler to start small and scale up that to start too large.
Run this diagnostic to see whether your bottleneck is query speed or concurrency:
-- Diagnose: are queries slow, or are they queuing?
SELECT
    DATE_TRUNC(hour, START_TIME) AS hour,
    COUNT(*) AS query_count,
    AVG(EXECUTION_TIME / 1000) AS avg_exec_seconds,
    AVG(QUEUED_OVERLOAD_TIME / 1000) AS avg_queue_seconds,
    SUM(CASE WHEN QUEUED_OVERLOAD_TIME > 0 THEN 1 ELSE 0 END) AS queued_queries,
    AVG(BYTES_SPILLED_TO_REMOTE_STORAGE) AS avg_remote_spill
FROM SNOWFLAKE.ACCOUNT_USAGE.QUERY_HISTORY
WHERE WAREHOUSE_NAME = 'YOUR_DOMO_WH'
  AND START_TIME >= DATEADD(day, -7, CURRENT_TIMESTAMP)
GROUP BY 1
ORDER BY 1;
Now in my example below, we’re doing pretty good - this is just our test warehouse, but you can see even at peak hour of 800 queries we average a sub second second response with 0 queuing and 0 spill, nothing to adjust here.
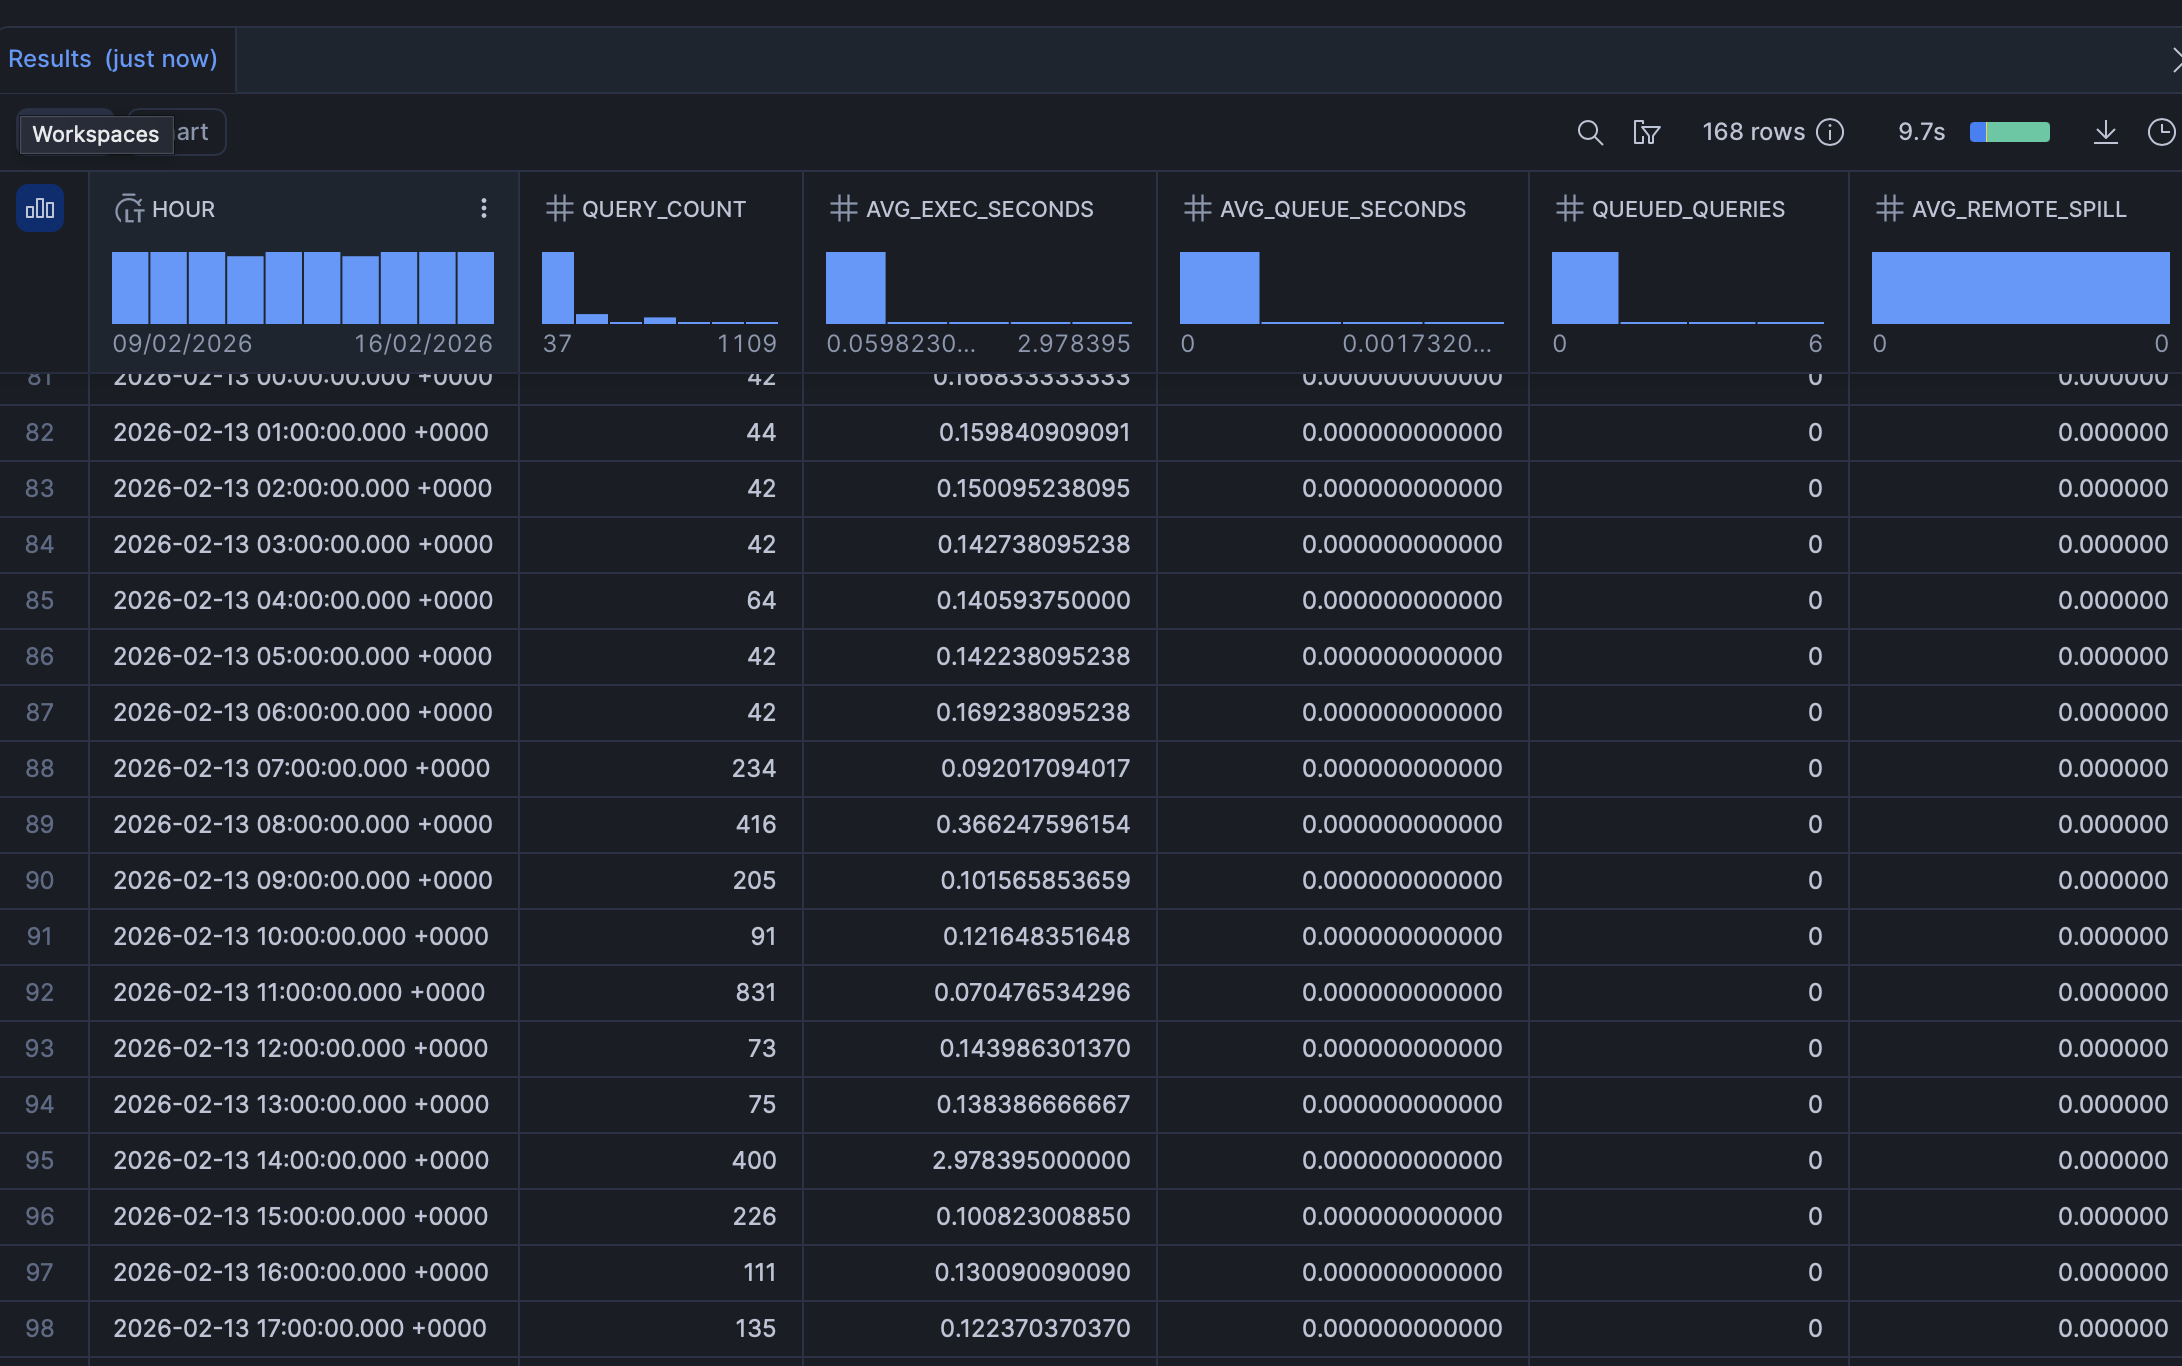
If yours looks different, here’s a guide on what to adjust depending on what you’re seeing
Reading the results:
| Signal | Diagnosis | Action |
|---|---|---|
High avg_exec_seconds, low avg_queue_seconds | Queries are slow, not queuing | Scale up (bigger size) |
Low avg_exec_seconds, high avg_queue_seconds | Queries are fast but waiting | Scale out (multi-cluster) |
High avg_exec_seconds, high avg_queue_seconds | Both problems | Scale up and out |
High avg_remote_spill | Warehouse too small for data volume | Scale up |
Recommendation: Start small and scale up, often an X-Small warehouse with multi-clustering enabled will suffice (many concurrent users generating low compute queries on a dashboard), if query times are long, upgrade the warehouse size.
Now we’ve covered how to right size your Snowflake warehouse, we’l look at some additional controls that you can use and implement optimise and to potentially save on costs.
2.3 Auto Suspend Strategy
Auto suspend is one of the most powerful cost control levers. The industry best practice is to default to 60 seconds for most workloads while Snowflake’s default of 5 - 10 minutes is unnecessarily expensive for typical BI usage.
You can set the auto-suspend period on the warehouse settings within Snowflake.
The Math on Auto Suspend:
- Medium warehouse running 24/7: 4 credits/hour × 24 hours = 96 credits/day
- Same warehouse with 60-second auto-suspend, active ~8 hours/day: ~32 credits/day
- Savings: 67%
2.4 Multi-Cluster Scaling Policies: Standard vs. Economy
When using multi-cluster warehouses in Auto-scale mode (where MAX_CLUSTER_COUNT > MIN_CLUSTER_COUNT), Snowflake offers two scaling policies that control how aggressively clusters are added and removed. Choose based on your concurrency patterns at different times of day.
Standard Policy (Default)
- Starts a new cluster after ~20 seconds of sustained queuing or high utilization
- Shuts down idle clusters after 2–3 minutes of low utilization
- Prioritizes performance over cost and minimizes query wait times
- Best for: Business hours when users expect fast dashboard responses
Economy Policy
- Waits ~6 minutes of sustained load before starting a new cluster
- Validates that the workload justifies the additional capacity before spinning up
- Prioritizes cost savings and accepts some queuing to avoid over-provisioning
- Best for: Off-peak hours, batch processing, workloads where a few seconds of queuing is acceptable
You can switch policies dynamically if needed, generally though, the default suits most cases.
-- Standard during business hours, Economy off-peak
-- (schedule via Snowflake Tasks — see section 2.5 below)
ALTER WAREHOUSE domo_bi_wh SET SCALING_POLICY = 'STANDARD';
ALTER WAREHOUSE domo_bi_wh SET SCALING_POLICY = 'ECONOMY';
2.5 Dynamic Warehouse Sizing: Don’t Run the Same Size 24/7
A warehouse doesn’t have to stay the same size around the clock. Snowflake lets you resize instantly even while queries are running and the change takes effect within seconds. Existing queries continue on the current size; new queries will use the updated configuration.
This is one of the most underused cost optimisation strategies. If your ETL runs at 4 AM on a Medium warehouse but your BI queries during the day only need an X-Small, you’re paying 4× more than necessary for 18+ hours a day.
Schedule Size Changes with Snowflake Tasks
Use Snowflake’s task scheduler to automate resizing based on predictable usage patterns:
-- Create a task to scale up for ETL window (4-6 AM)
CREATE OR REPLACE TASK scale_up_for_etl
    WAREHOUSE = 'TASK_ADMIN_WH'
    SCHEDULE = 'USING CRON 0 4 * * * America/New_York'
AS
    ALTER WAREHOUSE domo_etl_wh SET WAREHOUSE_SIZE = 'MEDIUM';

-- Scale back down after ETL completes
CREATE OR REPLACE TASK scale_down_after_etl
    WAREHOUSE = 'TASK_ADMIN_WH'
    SCHEDULE = 'USING CRON 0 6 * * * America/New_York'
AS
    ALTER WAREHOUSE domo_etl_wh SET WAREHOUSE_SIZE = 'XSMALL';

-- Scale up BI warehouse for business hours
CREATE OR REPLACE TASK scale_up_bi_hours
    WAREHOUSE = 'TASK_ADMIN_WH'
    SCHEDULE = 'USING CRON 0 8 * * MON-FRI America/New_York'
AS
    ALTER WAREHOUSE domo_bi_wh SET WAREHOUSE_SIZE = 'MEDIUM';

-- Scale down BI warehouse for evenings
CREATE OR REPLACE TASK scale_down_bi_evening
    WAREHOUSE = 'TASK_ADMIN_WH'
    SCHEDULE = 'USING CRON 0 18 * * MON-FRI America/New_York'
AS
    ALTER WAREHOUSE domo_bi_wh SET WAREHOUSE_SIZE = 'XSMALL';

-- Don't forget to resume the tasks
ALTER TASK scale_up_for_etl RESUME;
ALTER TASK scale_down_after_etl RESUME;
ALTER TASK scale_up_bi_hours RESUME;
ALTER TASK scale_down_bi_evening RESUME;
Combine Dynamic Sizing with Scaling Policies
For maximum control, pair time-based resizing with scaling policy switches:
-- Morning: Medium warehouse, Standard scaling (fast response)
-- 8 AM Mon-Fri
CREATE OR REPLACE TASK morning_config
    WAREHOUSE = 'TASK_ADMIN_WH'
    SCHEDULE = 'USING CRON 0 8 * * MON-FRI America/New_York'
AS
BEGIN
    ALTER WAREHOUSE domo_bi_wh SET
        WAREHOUSE_SIZE = 'MEDIUM'
        SCALING_POLICY = 'STANDARD';
END;

-- Evening: X-Small warehouse, Economy scaling (save credits)
-- 6 PM Mon-Fri
CREATE OR REPLACE TASK evening_config
    WAREHOUSE = 'TASK_ADMIN_WH'
    SCHEDULE = 'USING CRON 0 18 * * MON-FRI America/New_York'
AS
BEGIN
    ALTER WAREHOUSE domo_bi_wh SET
        WAREHOUSE_SIZE = 'XSMALL'
        SCALING_POLICY = 'ECONOMY';
END;

ALTER TASK morning_config RESUME;
ALTER TASK evening_config RESUME;
Cache Trade-off When Downsizing: When you decrease warehouse size, the SSD cache associated with the removed compute resources is dropped. If your morning dashboards rely on warm cache, schedule the upsize 15–30 minutes before peak usage to allow the cache to warm up.
The Math on Dynamic Sizing:
Consider a warehouse that needs Medium (4 credits/hour) during business hours and X-Small (1 credit/hour) suffices for evenings:
- Static Medium 24/7: 4 × 24 = 96 credits/day
- Dynamic (Medium 8 AM–6 PM, X-Small 6 PM–8 AM): (4 × 10) + (1 × 14) = 54 credits/day
- Savings: 44% before auto-suspend kicks in.
2.6 Separate Warehouses for Different Workloads
You can provision different warehouses for different tasks - one for ETL and one for BI. ETL only applies in a Domo context if you have Push down SQL enabled on your instance, if you use this, having separation is beneficial.
Example Architecture:
DOMO_ETL_WH (Medium)
├── Scheduled DataFlows
├── Large dataset refreshes
├── Run during off-peak hours (evenings/nights)
└── Auto-suspend: 60 seconds

DOMO_BI_WH (Small, Multi-cluster)
├── Dashboard queries
├── Ad-hoc analysis
├── Business hours usage
└── Auto-suspend: 60 seconds (or 5 min if cache matters)

DOMO_ADHOC_WH (X-Small, auto-scaling)
├── Power user exploration
├── Data science experiments
├── Can be paused when not needed
└── Auto-suspend: 60 seconds
Part 3: Monitoring and Governance
You can’t optimse what you don’t measure. Set up visibility into your Domo–Snowflake costs.
3.1 Build a Cost Monitoring Dashboard in Domo
Data Sources:
SNOWFLAKE.ACCOUNT_USAGE.QUERY_HISTORY- Query detailsSNOWFLAKE.ACCOUNT_USAGE.WAREHOUSE_METERING_HISTORY- Credit consumptionSNOWFLAKE.ACCOUNT_USAGE.METERING_DAILY_HISTORY- Daily credit summariesSNOWFLAKE.ACCOUNT_USAGE.QUERY_ATTRIBUTION_HISTORY- Per-query credit attribution
Key Metrics to Track:
- Daily Credit Consumption by Warehouse
- Top 20 Most Expensive Queries (filter for Domo user)
- Query Volume by Hour (identify peaks)
- Average Query Duration Trends
- Cache Hit Rate (PERCENTAGE_SCANNED_FROM_CACHE in query history)
Sample Query for Domo Costs:
SELECT
    DATE(qh.START_TIME) AS date,
    qh.WAREHOUSE_NAME,
    COUNT(*) AS total_queries,
    SUM(qa.CREDITS_ATTRIBUTED_COMPUTE) AS total_credits,
    AVG(qh.EXECUTION_TIME / 1000) AS avg_seconds,
    PERCENTILE_CONT(0.95) WITHIN GROUP
        (ORDER BY qh.EXECUTION_TIME / 1000) AS p95_seconds
FROM SNOWFLAKE.ACCOUNT_USAGE.QUERY_HISTORY qh
LEFT JOIN SNOWFLAKE.ACCOUNT_USAGE.QUERY_ATTRIBUTION_HISTORY qa
  ON qh.QUERY_ID = qa.QUERY_ID
WHERE qh.USER_NAME LIKE '%DOMO%'
  AND qh.START_TIME >= DATEADD(day, -30, CURRENT_TIMESTAMP)
GROUP BY 1, 2
ORDER BY 1 DESC, 4 DESC;
Note: QUERY_ATTRIBUTION_HISTORY has a latency of up to 6 hours and data is available from mid-August 2024 onward. For real-time credit monitoring, use WAREHOUSE_METERING_HISTORY instead.
3.2 Set Up Cost Alerts
Configure Snowflake Resource Monitors:
CREATE RESOURCE MONITOR domo_monthly_budget WITH
    CREDIT_QUOTA = 1000  -- Adjust to your budget
    FREQUENCY = MONTHLY
    START_TIMESTAMP = IMMEDIATELY
    TRIGGERS
        ON 75 PERCENT DO NOTIFY
        ON 100 PERCENT DO SUSPEND_IMMEDIATE;

ALTER WAREHOUSE your_domo_wh SET
    RESOURCE_MONITOR = domo_monthly_budget;
Part 4: Quick Wins Checklist
Domo Optimisations
- Align freshness check intervals with actual data update schedules and disable off-hours checks in advanced scheduling settings (if applicable to you).
- Increase Cloud Amplifier cache TTL beyond the 15-minute default for datasets that update less frequently.
- Review Beast Modes with complex calculations and push to ETL if used across multiple cards.
- Archive or delete unused datasets (check “Last Viewed” in Domo).
Snowflake Optimisations
- Set auto-suspend to 60 seconds on all BI warehouses (extend to 5 min only where cache warmth matters).
- Separate ETL and BI workloads to different warehouses.
- Start small - run provided SQL to identify bottlenecks and scale up or out accordingly.
- Enable multi-cluster warehouses with concurrency issues (requires Enterprise Edition)
- Schedule heavy ETL during off-peak hours (evenings/weekends)
- Run the scaling diagnostic query (section 2.3) to identify whether you need to scale up, out, or both
- Implement dynamic sizing with Snowflake Tasks - don’t pay for Medium 24/7 if you only need it 10 hours/day
Monitoring
- Create cost dashboard in Domo using Snowflake ACCOUNT_USAGE views
- Set up resource monitors with alerts at 75% and 100% of budget
- Identify and optimise top 10 most expensive queries weekly
Conclusion
Snowflake cost optimisation isn’t a one-time project it’s an ongoing process. The good news: Domo gives you visibility and control over query patterns that many BI tools don’t. By optimising both how Domo requests data and how Snowflake processes it, you can dramatically reduce costs while maintaining performance.
Start with the quick wins: audit your dataset refresh frequencies and set aggressive auto-suspend (60 seconds as your baseline). Then build your cost monitoring dashboard to track progress. Within 30 days, you should see meaningful reductions in your Snowflake bill.
Next Steps:
- Run the query analysis in Snowflake to understand your baseline
- Implement the quick wins checklist
- Build your cost monitoring dashboard
- Schedule monthly optimisation reviews